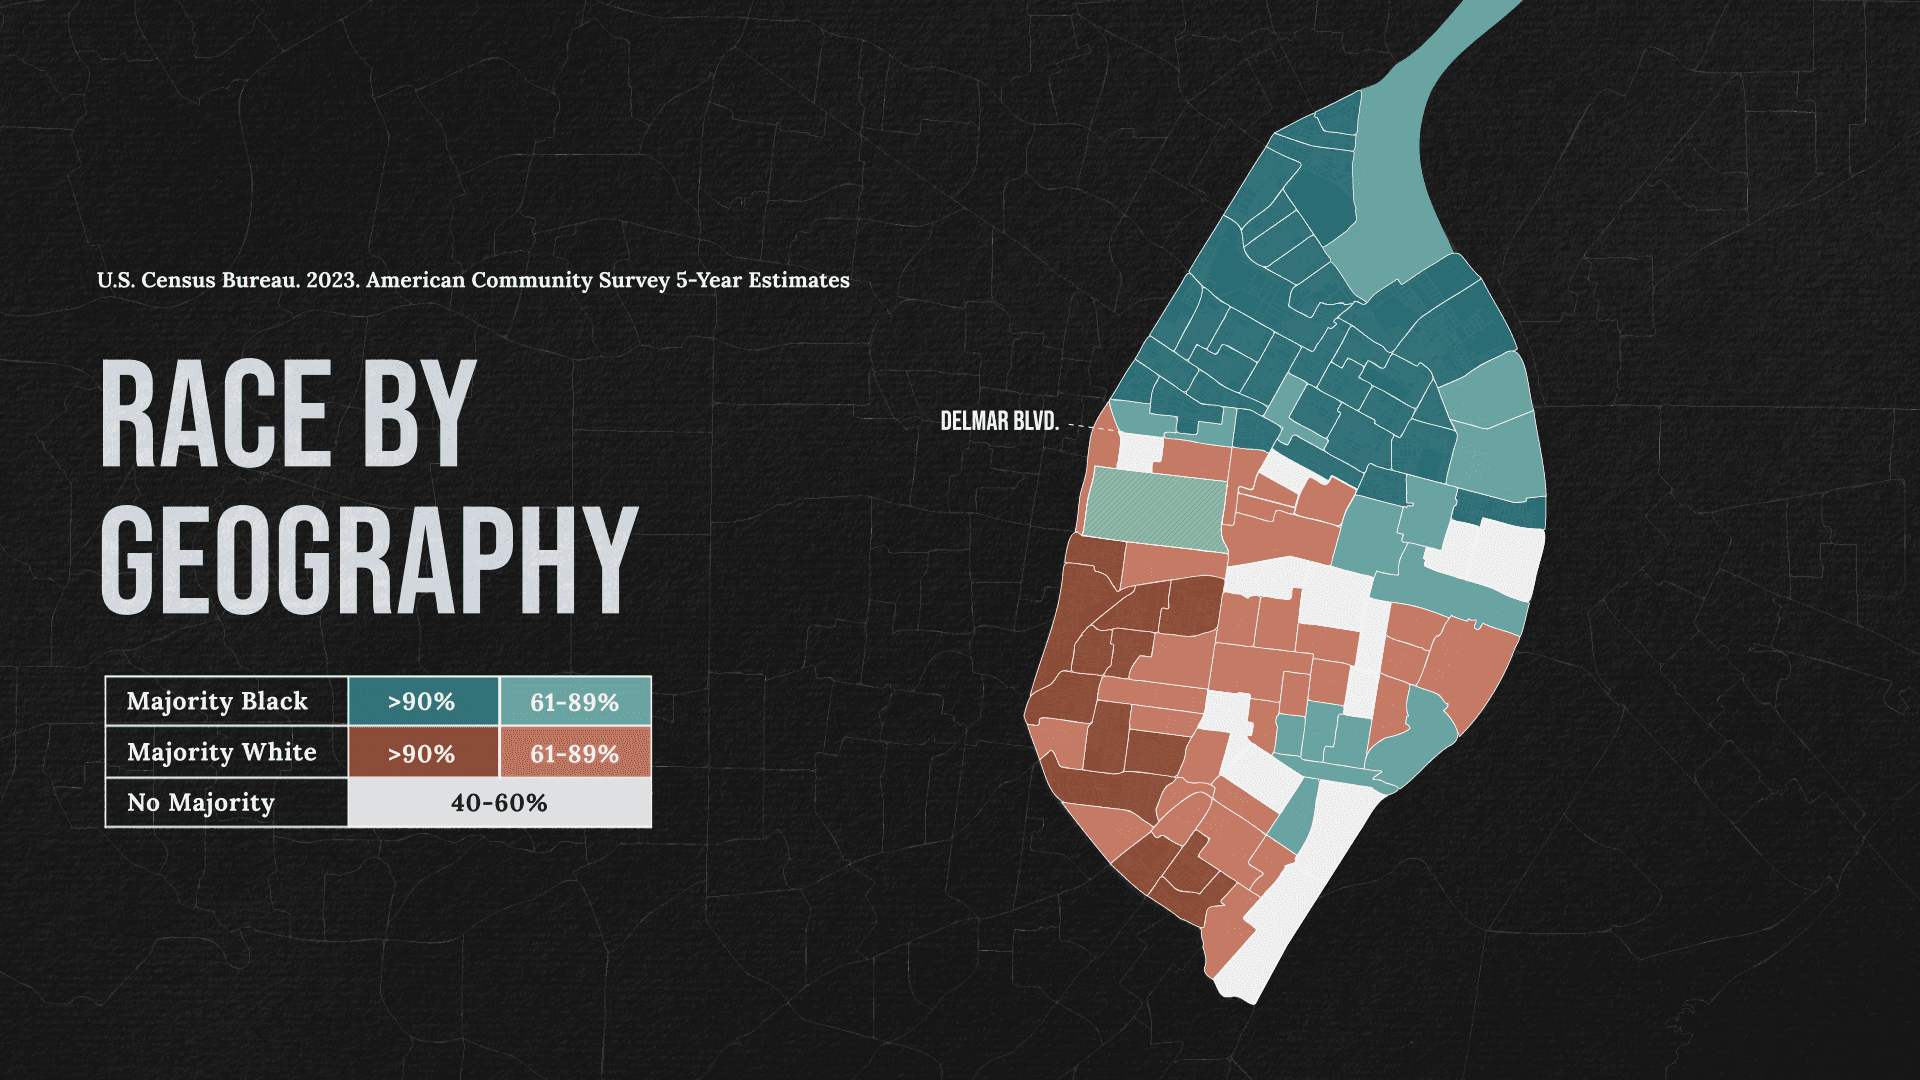
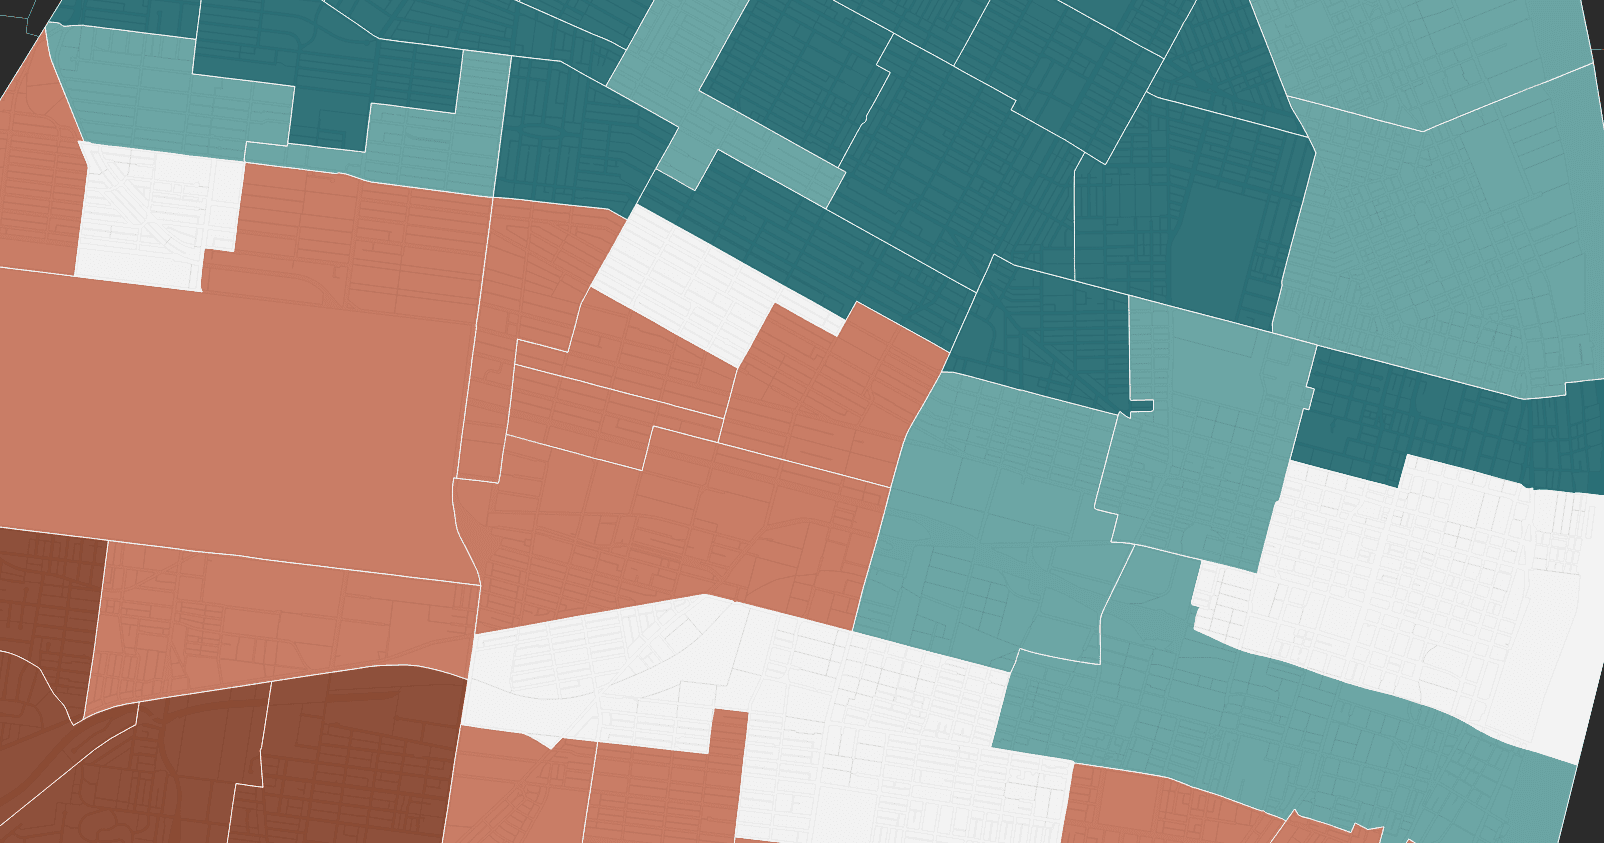
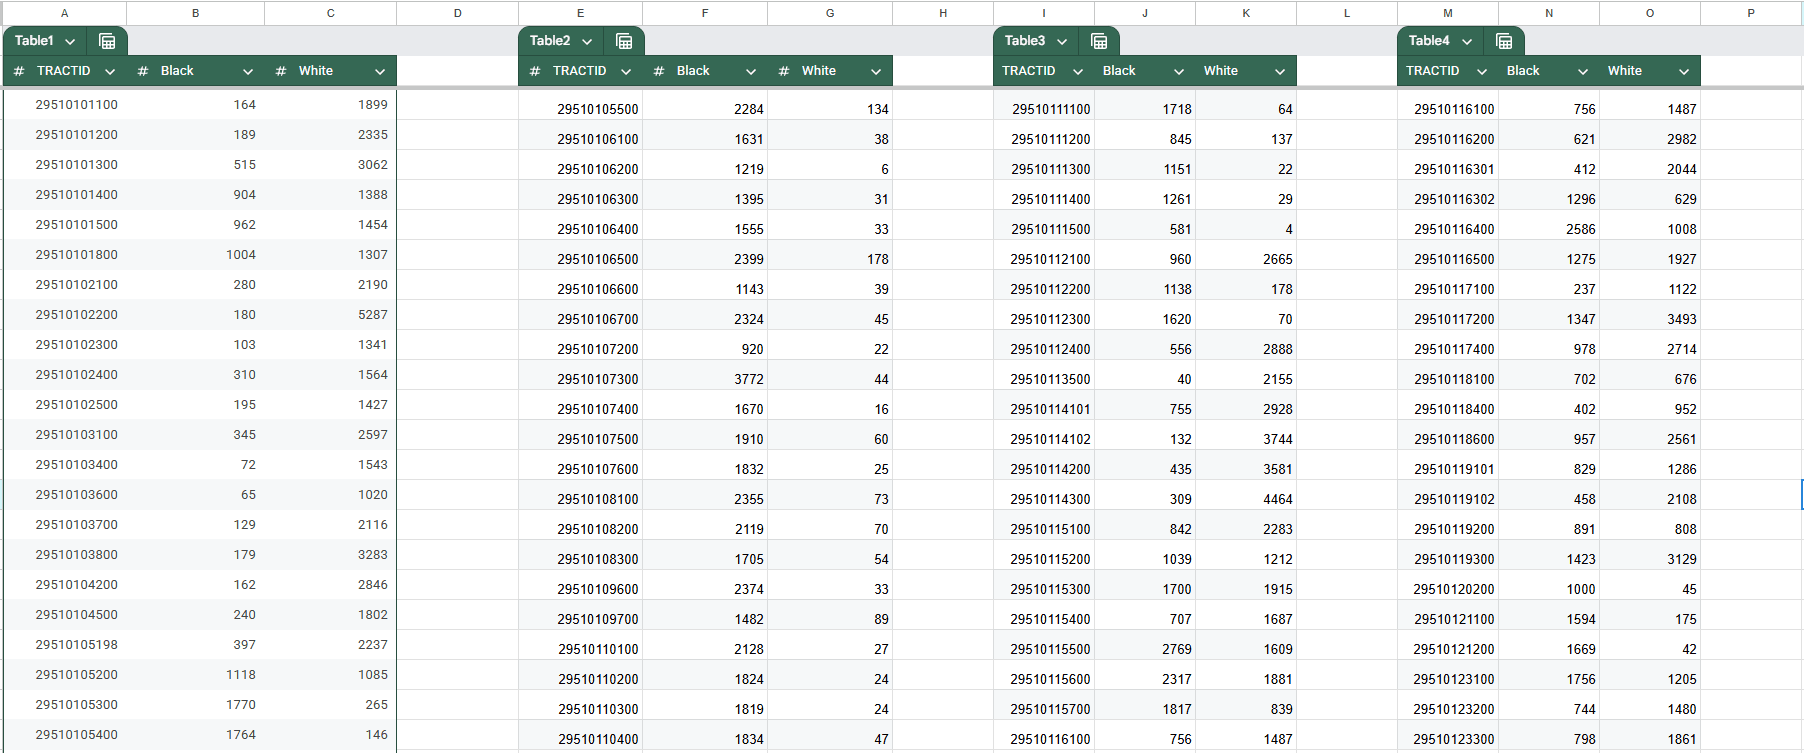
This motion graphic explores the Delmar Divide in St. Louis through census data. I collected and analyzed demographic information, experimenting with geospatial software and choropleth maps in QGIS to visualize patterns of race and geography. The project emphasizes the importance of data-driven design in revealing social disparities and translating complex information into a clear, compelling narrative.


PREVIOUS
NEXT
This motion graphic explores the Delmar Divide in St. Louis through census data. I collected and analyzed demographic information, experimenting with geospatial software and choropleth maps in QGIS to visualize patterns of race and geography. The project emphasizes the importance of data-driven design in revealing social disparities and translating complex information into a clear, compelling narrative.
INTERACTION DESIGN
ANIMATION
ILLUSTRATION
GIS+ DATA
MOTION DESIGN
GIS+ DATA
MOTION DESIGN
SELF INITIATED
This motion graphic explores the Delmar Divide in St. Louis through census data. I collected and analyzed demographic information, experimenting with geospatial software and choropleth maps in QGIS to visualize patterns of race and geography. The project emphasizes the importance of data-driven design in revealing social disparities and translating complex information into a clear, compelling narrative.